
View detailed results for scenario tests in your Mobile App project.
Page Overview #
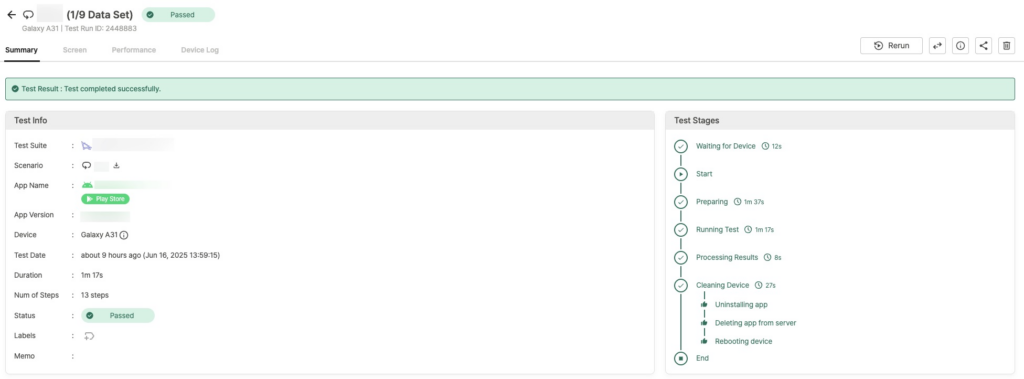

- Basic Information
- Scenario name and result status
- Data-Driven Test icon
 and Data Set row number (when Data Set is configured)
 - Device information (e.g., Galaxy A31)
- Test Run ID (unique identifier)

- Available Options
- Rerun: Run the test again with the same settings
- Share, Info, Delete: Test management functions
→ Additional Usage Guide > 3.0. Using Ptero Test Results
Tabs #
Test result details are organized into the following tabs:
- Summary: Overview and execution stages of the test
- Screen: Screenshots and captures from each test step
- Performance: CPU and memory usage during testing
- Device Log: Collected device logs
Summary #
Test Result #
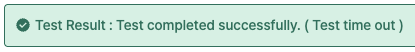
A summary banner is shown at the top based on the test result.
Test Info #
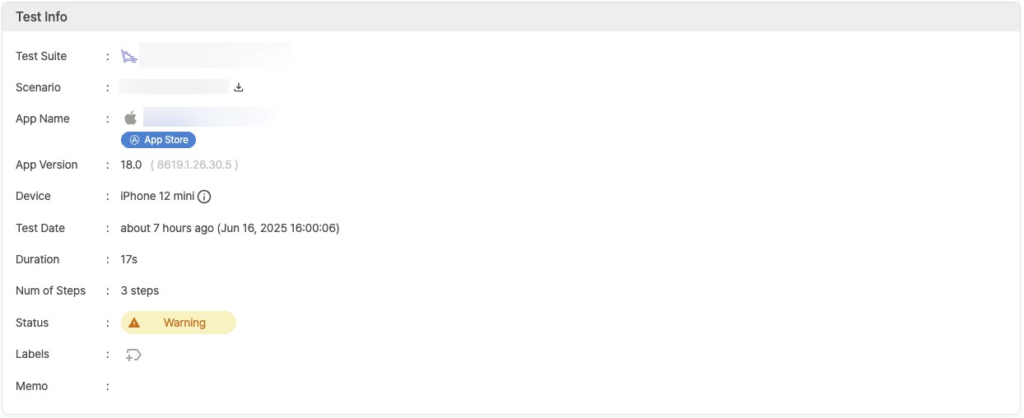
Displays key information about the test run:
- Test Suite: Name of the Test Suite used
- Scenario:
- Scenario name and icon
- Scenario file download button
- App Name: Test target app identifier (e.g., com.apple.mobilesafari)
- App Version: Version of the app
- Device: Device model used (e.g., iPhone 12 mini)
- Hover over the device info icon for detailed tooltip
- Test Date: Test execution time
- Duration: Test duration
- Num of Steps: Number of executed steps
- Status: Final result status
- Labels: Labels set on the test
- Memo: Test notes
Test Stages #
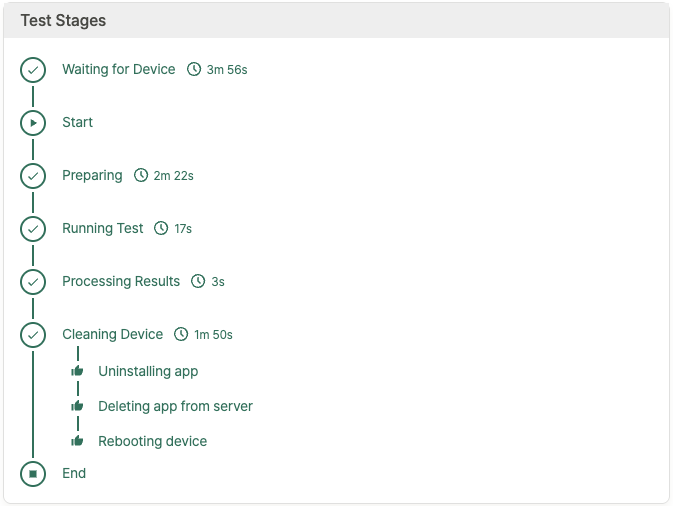
Visual representation of each stage of the test:
- Waiting for Device: Device waiting stage
- Start: Starting the test
- Preparing: Preparing environment
- Running Test: Actual test execution
- Processing Results: Processing results
- Cleaning Device: Cleaning up device
- Uninstalling app
- Deleting app from server
- Rebooting device
- End: Test completed
Step with Issues #
Steps that resulted in a Warning or Failed status are shown here. Passed steps are not included in this section.

- Step #: Issue step number
- Time: Time of execution
- Step Name: Name of the step
- Action: Action performed in the step
- Description: Description of the issue
- Result: execution result status
Clicking a table row shows a screenshot of the step.
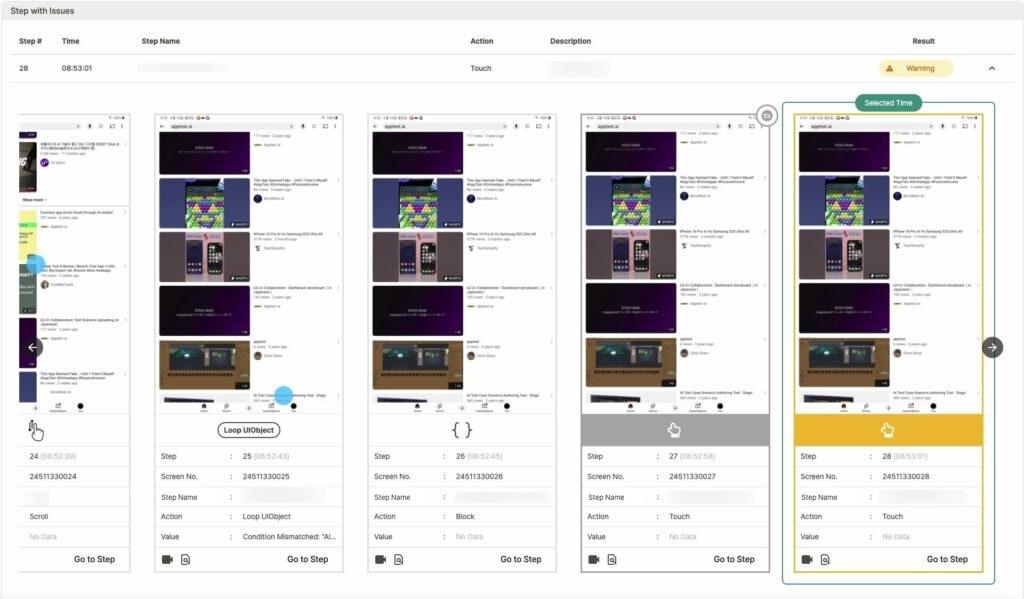
Below each screenshot, additional details are displayed:
- Step: Step number and execution time
- Screen No.: Screen identifier
- Step Name: Name of the step
- Action: Action executed in the step
- Value: Result or status value
- Screenshot Options:
 : Play video of the step
 : View detailed execution results for the step
- Compare test execution screens with scenario creation screens
 : Jump to this step in the Screen tab
Screen #
The Screen tab shows each screen captured per step.
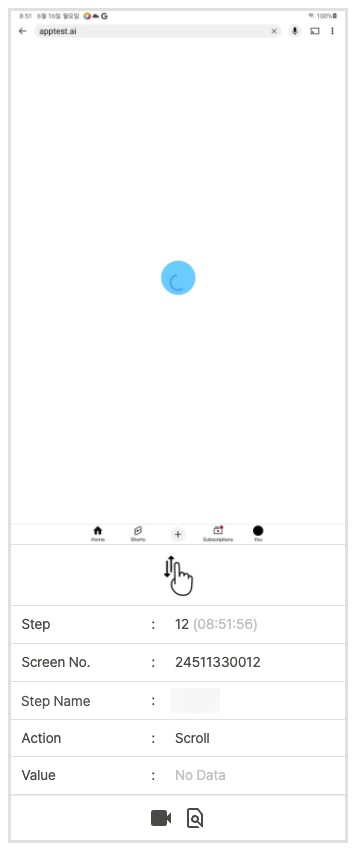
- Action Icon: Icon for the action performed
- Step: Step number and execution time
- Screen No.: Screen identifier
- Step Name: Name of the step
- Action: Action executed in the step
- Value: Result or status value
- Screenshot Options:
- : Play video of the step
- : View detailed execution results for the step
- Compare test execution screens with scenario creation screens
Performance #
Shows CPU usage and memory consumption as a graph.
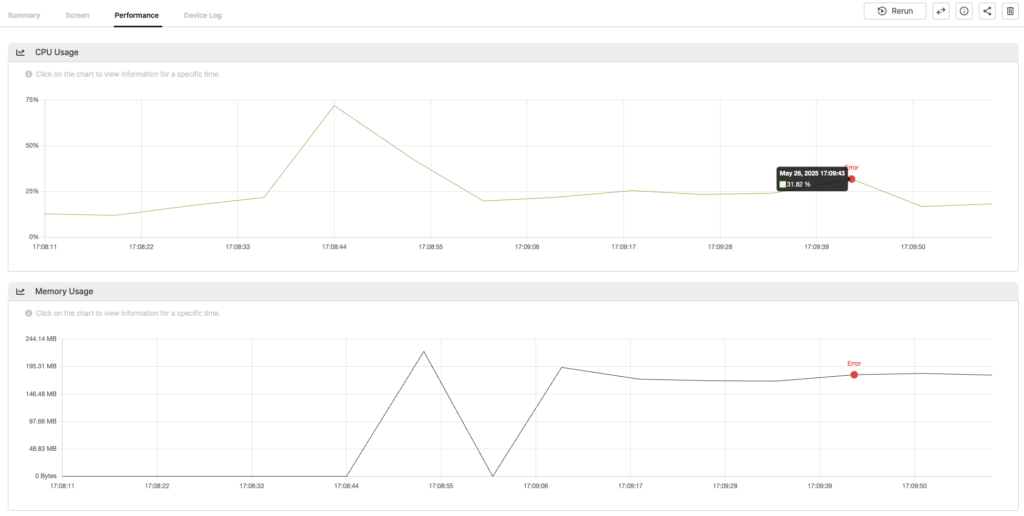
- CPU Usage: CPU usage changes
- Memory Usage: memory consumption changes
- Tooltips: Hover over graph points to see time and usage information
- Error Points: Highlighted in the graph. Clicking them shows related screenshots and device logs.
Device Log #
View collected device logs.
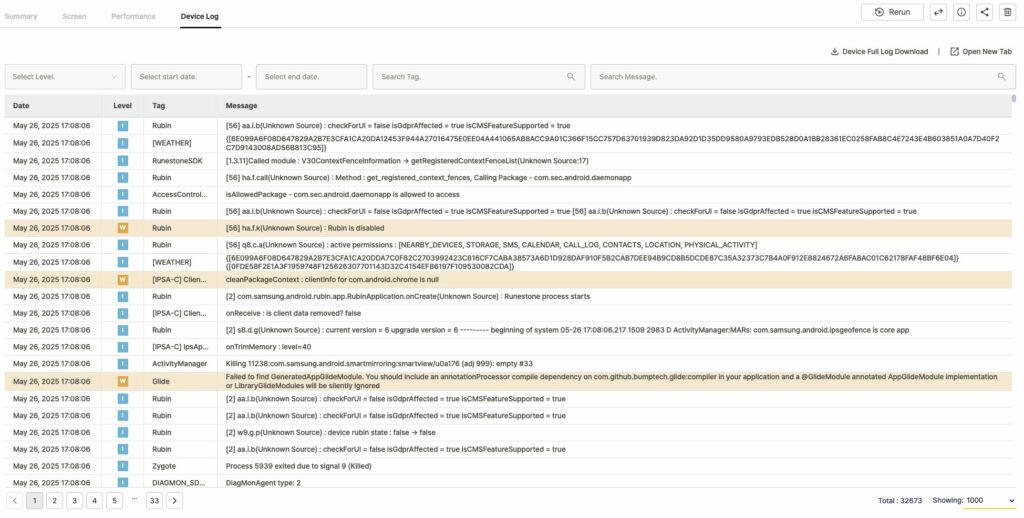
- Device Full Log Download: Download all collected logs as a zip file. Includes all system logs during the test.
- Open New Tab: Opens the Device Log in a new browser tab.
- Log Filtering
- Select Level: Filter by log level (Notice, Warning, Error, Fault)
- Date Range
- Select start date: Set start date for logs to review
- Select end date: Set end date for logs to review
- Search Tag: Filter by log tag
- Search Message: Filter logs containing specific keywords
- Log Table Fields
- Date: Log timestamp
- Level: Log level
- Tag: Log tag
- Message: Log message content