
After tests finish running, you can review results in two places:
the Dashboard for a cross-project snapshot, and the Run Results tab inside each project for detailed filtering and drill-down.
Dashboard overview #
The Dashboard gives you a quick snapshot of your team’s recent test activity across all projects.
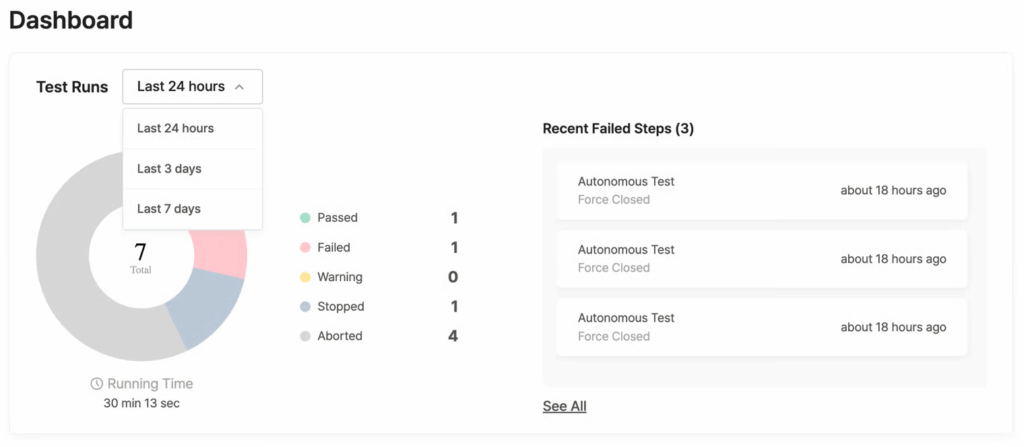
- Period selector: choose Last 24 hours, Last 3 days, or Last 7 days to set the reporting window.
- Pie chart and status counts: a visual breakdown of results by status (Passed, Failed, Warning, Stopped, Aborted).
See Understanding test statuses for definitions. - Running Time: total test execution time for the selected period.
- Recent Failed Steps: lists recent failures with the Test Suite name, result, and elapsed time. Click See All to open the full list.
The Dashboard also shows a Recent Test Runs table with per-test rows. This table uses the same columns and actions described in Browsing Test Runs below, plus a Project column so results from every project appear together.
Test Suite Runs vs. Test Runs: which view to use? #
Every project’s Run Results tab offers two sub-tabs. Pick the one that matches what you need:
| Test Suite Runs | Test Runs | |
|---|---|---|
| Shows | One row per Test Suite execution | One row per individual test |
| Best for | Checking overall Suite outcomes at a glance | Drilling into a specific test failure |
| Key metrics | Total Runs, Success Rate, Passed, Failed | Same, plus Avg Duration |
| Bulk actions | Stop, Delete | Add Label, Stop, Change Status, Delete |
Tip:
When a Test Suite contains only a single scenario (including Autonomous Test Suites), both views lead to the same detail page.
Browsing Test Suite Runs #
Open your project and select Run Results > Test Suite Runs.
Summary metrics #
The top bar shows aggregate numbers for the selected period (24h / 3d / 7d):
- Total Runs: total executions
- Success Rate: percentage of passed runs
- Total Passed / Total Failed: absolute counts
- Status breakdown: Passed, Failed, Warning, Stopped, Aborted
Results table #
Each row represents one Test Suite execution.
| Column | Description |
|---|---|
| ID | Unique run ID. An asterisk (*) suffix indicates an immediate run triggered via Run Test. |
| Test Suite | Name of the executed Test Suite. |
| Status | Test result. Hover to see previous and current status if the result changed. |
| Device / OS | Target device and operating system. |
| Run Date | Start timestamp and total duration (e.g., Jun 14, 2025 09:45, 00:28:30). |
| Results | Pass ratio of scenarios within the Suite. |
Filtering results #
Click Filter above the table. Available filters:
- Test Suites: limit to specific Suites
- Status: filter by outcome
- OS: Android or iOS
- Device: specific device models
- Run Date: date range
Rerunning a Test Suite #
Click the Rerun button on any row to run the Test Suite again with the same settings.
Managing selected items #
Select one or more rows using the checkboxes, then choose an action:
- Stop Tests: halt running executions
- Delete Tests: remove selected results
Browsing Test Runs #
Open your project and select Run Results > Test Runs.
Summary metrics #
Same period selector and status breakdown as Test Suite Runs, with one addition:
- Avg Duration: average execution time across all runs in the period.
Results table #
Each row represents one individual test execution.
| Column | Description |
|---|---|
| ID | Unique run ID. Asterisk (*) suffix = immediate run. |
| Test Run | Test Suite and scenario name. |
| Status | Test result. Hover to see previous and current status if the result changed. |
| Device / OS | Target device and OS. |
| Run Date | Start timestamp and total duration. |
| Label | Assigned label. Only predefined labels are available. Define labels in Team Settings. |
Filtering results #
All filters from Test Suite Runs, plus:
- Scenario: limit to a specific scenario
- Label: filter by assigned label
Rerunning a test #
Click the Rerun button on any row to run the test again with the same settings.
Managing selected items #
Select rows with checkboxes. Available actions:
- Add Label: assign a label to selected tests
- Stop Tests: halt running tests
- Change Test Status: manually override the status of selected tests
- Delete Test: remove selected results
Viewing results for a specific Test Suite #
Click any row in the Test Suite Runs table to open that Suite’s dedicated results page.
Page header #
- Suite name and icon: Scenario Test Suites display a Stego logo before the name.
- Run ID and overall execution status.
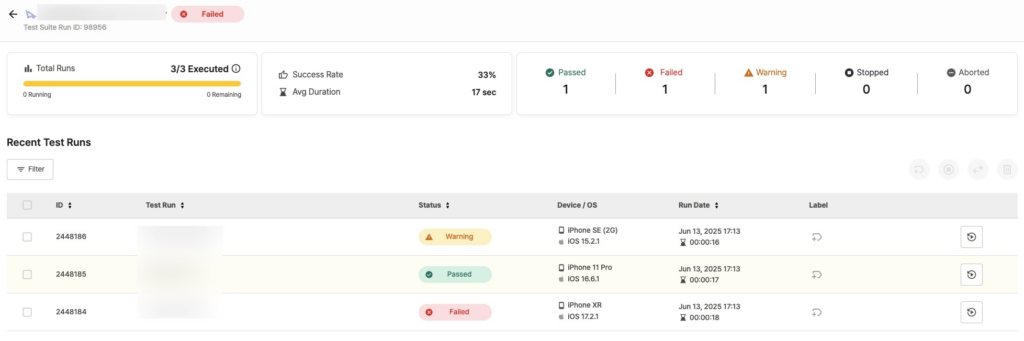
Key metrics #
- Success Rate: percentage of tests that passed within this Suite run.
- Avg Duration: average execution time per test.
- Execution Progress: completion ratio of planned scenarios (e.g.,
3/3 Executed) with Running and Remaining counts. - Status breakdown: Passed, Failed, Warning, Stopped, Aborted.
Results table #
The table lists individual tests within the Suite. Columns match the Test Runs table described in Browsing Test Runs: ID, Test Run, Status, Device / OS, Run Date, and Label.
Filtering, rerunning, and managing #
Same controls as Browsing Test Runs — filters, Rerun button, and bulk actions (Add Label, Stop, Change Status, Delete) all work identically.
Understanding test statuses #
Every test result carries one of five statuses. Use the table below to decide what action, if any, is needed.
| Status | Meaning | What to do |
|---|---|---|
| Passed | Test completed successfully. | No action needed. |
| Failed | Assertion failure, error detected, or critical issue (ANR, force close, etc.). | Review failed steps in the detail page. |
| Warning | Needs manual review, or a Failed-level issue downgraded to Warning by your settings. | Check the detail page. Change status, rerun, or update the scenario. |
| Stopped | Manually stopped by a user. | — |
| Aborted | The system terminated the test due to an internal issue. | Contact your administrator if this persists. |
When a status changes after the initial result, hover over the status icon to see both the previous and current status in a tooltip.
Tip for scenario tests:
Both Failed and Warning results can indicate that a UI or spec change has made your scenario outdated.
If the same scenario keeps failing or triggering warnings after a product update, review and update the scenario steps before rerunning.