Every completed test produces a detail page with tabs for different aspects of the result. The tabs available depend on the test type.
What you see on a result detail page #
| Tab | Autonomous (Mobile App) | Scenario (Mobile App / D2D Mobile App) |
|---|---|---|
| Summary | Yes | Yes |
| Activity Map | Yes | No |
| Screen | Yes | Yes |
| Performance | Yes | Yes |
| Device Log | Yes | Yes |
The key difference:
Autonomous tests include an Activity Map tab showing AI-explored screens and navigation paths. Scenario tests do not have this tab.
Page header #
Basic information #
The header displays:
- Test name and result status: Autonomous tests show “Autonomous Test”; Scenario tests show the scenario name.
- Device information: model name (e.g.,
iPhone 11,Galaxy A31). - Test Run ID: unique identifier for this execution.
Scenario / D2D: A Data-Driven Test icon and the Data Set row number appear when a Data Set is configured.
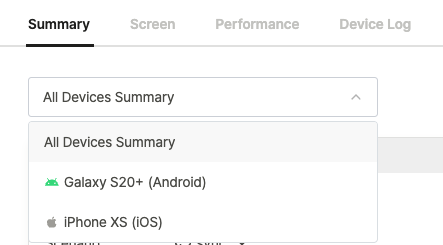
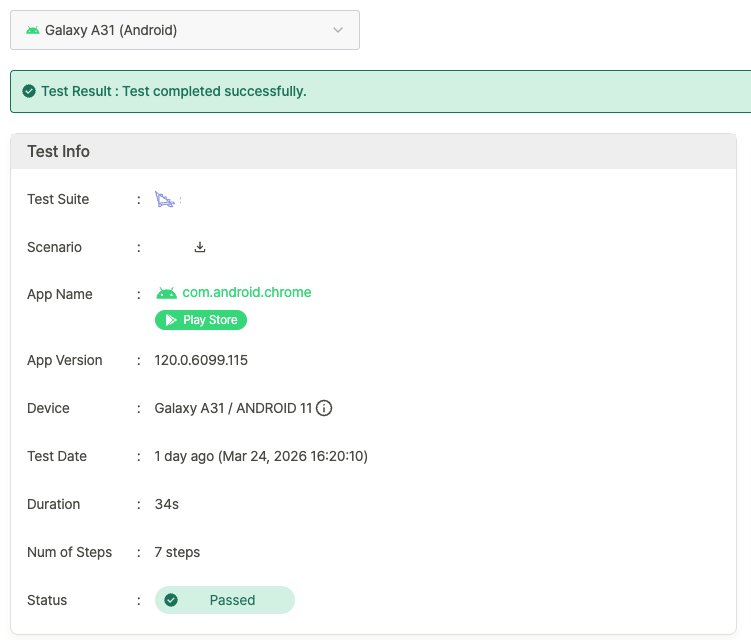
D2D only:
A device dropdown at the top of the page switches between All Devices Summary (aggregated view across all devices) and individual device results. All tabs reflect the selected device.
Result management options #
The toolbar above the tabs provides:
- Rerun: run the test again with the same configuration.
- Share / Info / Delete: share, view metadata, or remove the result.
For details on each option, see Managing and Sharing Test Results.
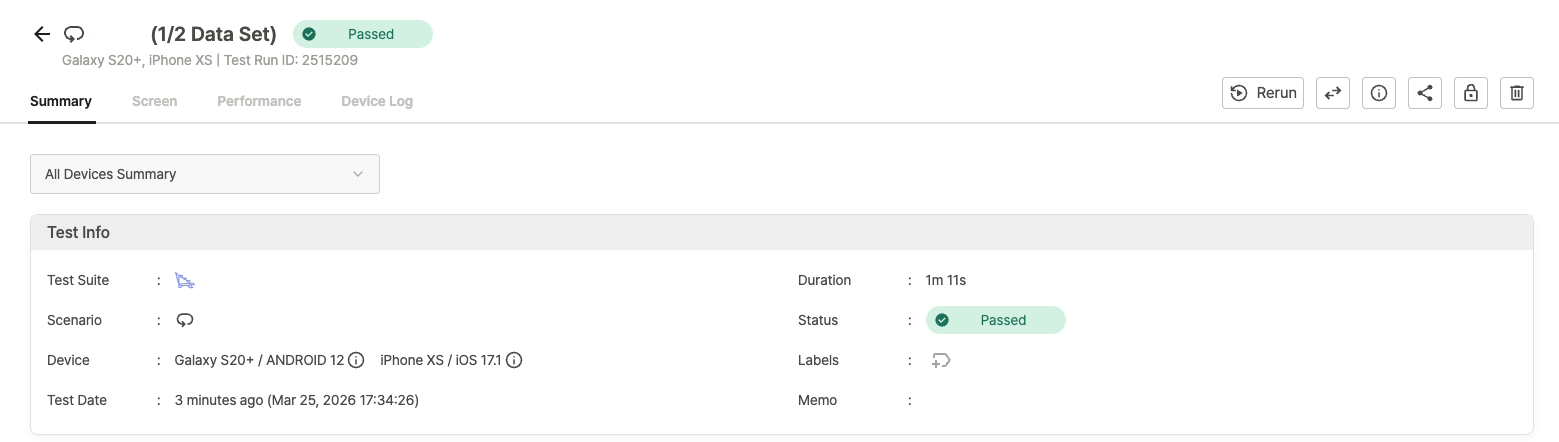
Summary tab #
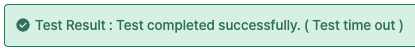
Test result banner #
A banner at the top indicates the overall test result (Passed, Warning, or Failed).
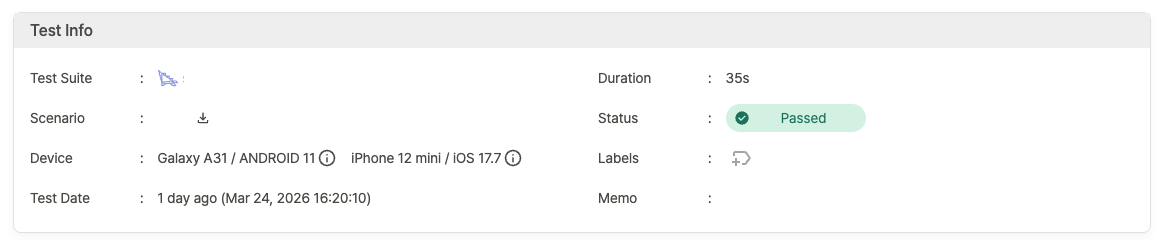
Test info #
Key metadata for the test run:
| Field | Description | Notes |
|---|---|---|
| Test Suite | Name of the Test Suite | |
| Scenario | Scenario name or “Autonomous Test” | Scenario tests include a file download button |
| App Name | App identifier (e.g., com.apple.mobilesafari) | |
| App Version | Version of the tested app | |
| Device | Device model (e.g., iPhone 12 mini) | Hover the info icon for a detailed tooltip |
| Test Date | Execution timestamp | |
| Duration | Total test time | |
| Num of Steps | Total executed steps | |
| Status | Final result status | |
| Labels | Labels applied to the result | |
| Memo | Notes attached to the test |
D2D — All Devices Summary:
Only essential fields are shown (Test Suite, Scenario, Device, Test Date, Duration, Status, Labels, Memo).
Per-device fields like App Name, App Version, and Num of Steps are omitted — switch to an individual device to see them.
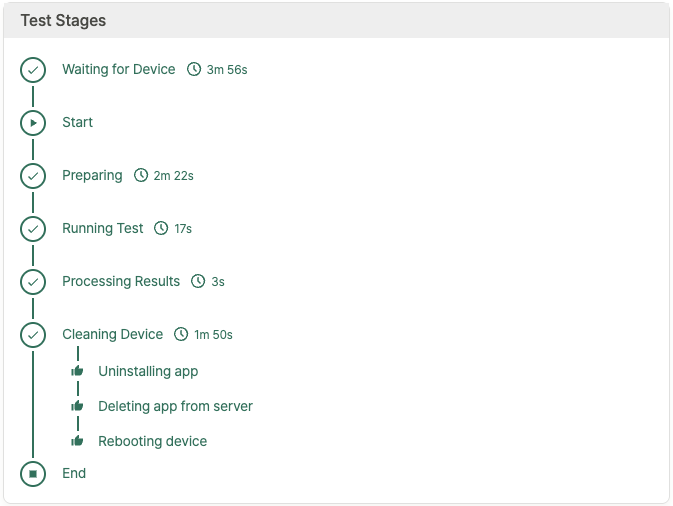
Test stages #
A visual timeline tracks each stage of the test lifecycle:
- Waiting for Device: queued for an available device.
- Start: test begins.
- Preparing: environment setup.
- Running Test: test execution in progress.
- Processing Results: results are generated.
- Cleaning Device: post-test cleanup (uninstalling app, deleting app from server, rebooting device).
- End: test complete.
D2D — All Devices Summary:
Test stages are not displayed. Switch to an individual device to see its stage timeline.
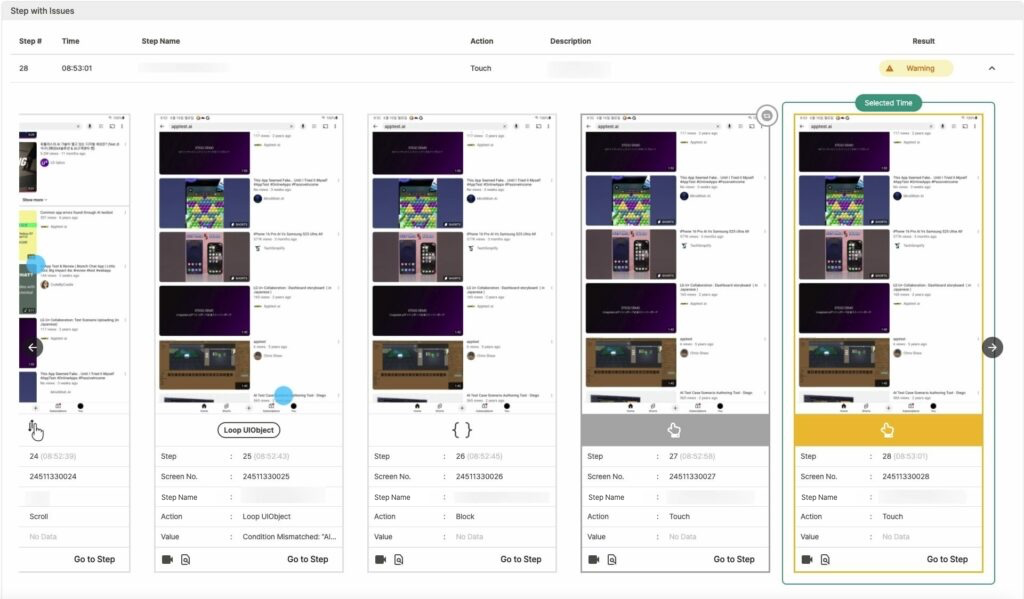
Steps with issues #
This section lists only steps that resulted in Warning or Failed. Passed steps are not shown.
| Column | Description |
|---|---|
| Step # | Step number |
| Time | Execution timestamp |
| Step Name | Name of the step |
| Action | Action performed |
| Description | Issue details |
| Result | Step status |
D2D — All Devices Summary:
An additional Device column identifies which device encountered the issue.
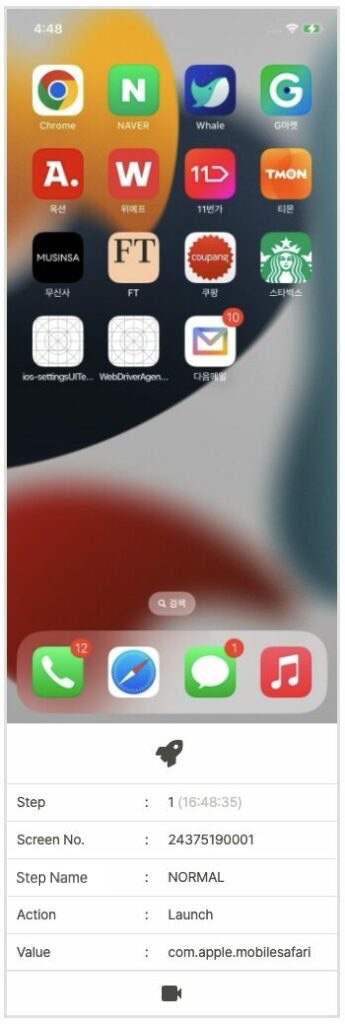
Click any row to open a screenshot popup with step details:
- Step: step number and execution time.
- Screen No.: unique screen identifier.
- Step Name: name of the step.
- Action: action executed.
- Value: result or status value.
Screenshot options in the popup:
- Play video: replay the step as a video.
- Jump to Screen tab: navigate to this step in the Screen tab.
Scenario / D2D:
An additional View detailed execution results option opens a Step Result popup comparing the execution screen against the scenario creation screen, showing UI element coordinates and screen state.
Activity Map tab #
Autonomous tests only.
The Activity Map visualizes every screen the AI explored and the navigation paths it took.
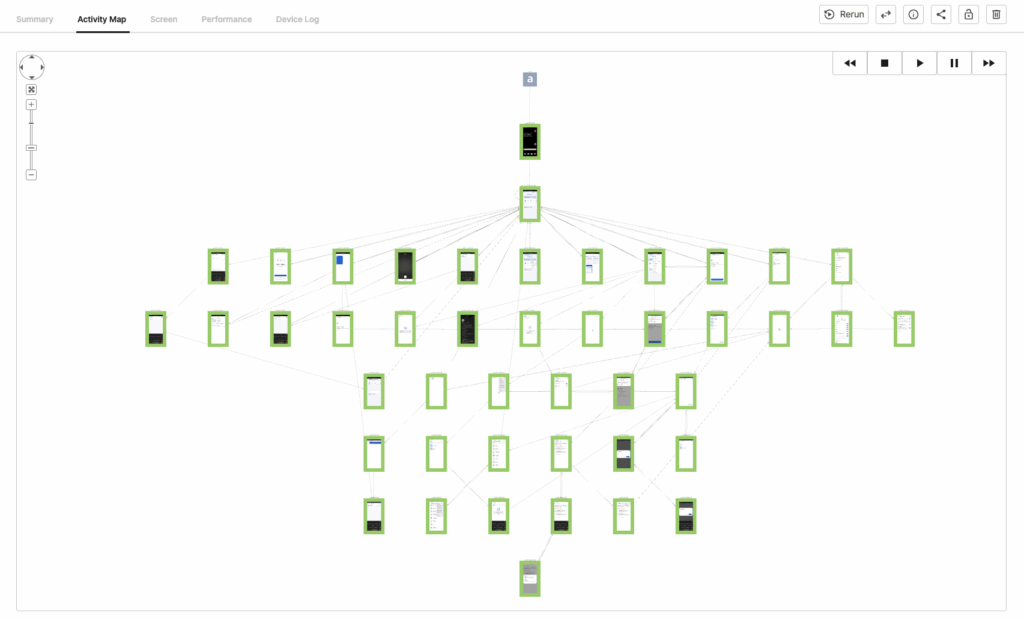
Navigation tools #
- Joystick controls: pan the map in any direction.
- Center button: reset the view to center.
- Zoom: click + to zoom in, – to zoom out.
Path replay toolbar #
Press Play to see the order in which the AI explored each screen. Click any screen on the map to view its screenshot and step details.
Screen tab #
Step-by-step screenshots captured during the test. Each entry shows:
| Field | Description |
|---|---|
| Action Icon | Visual indicator of the action type |
| Step | Step number and execution time |
| Screen No. | Unique screen identifier |
| Label | Step name |
| Action | Action performed |
| Value | Result or status value |
Screenshot options:
- Play video: replay the step as a video.
Scenario / D2D:
An additional View detailed execution results option opens a Step Result popup comparing the execution screen against the scenario creation screen.
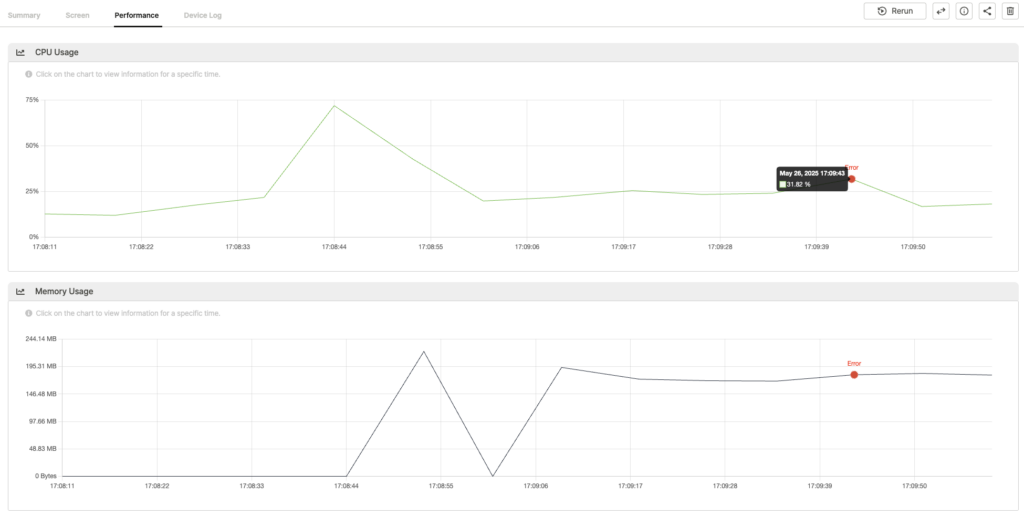
Performance tab #
Graphs showing resource consumption during the test:
- CPU Usage: CPU utilization over time.
- Memory Usage: memory consumption over time.
Hover over any data point for a tooltip with the exact timestamp and usage value. Error points are highlighted on the graph; click one to view the related screenshot and device log entry.
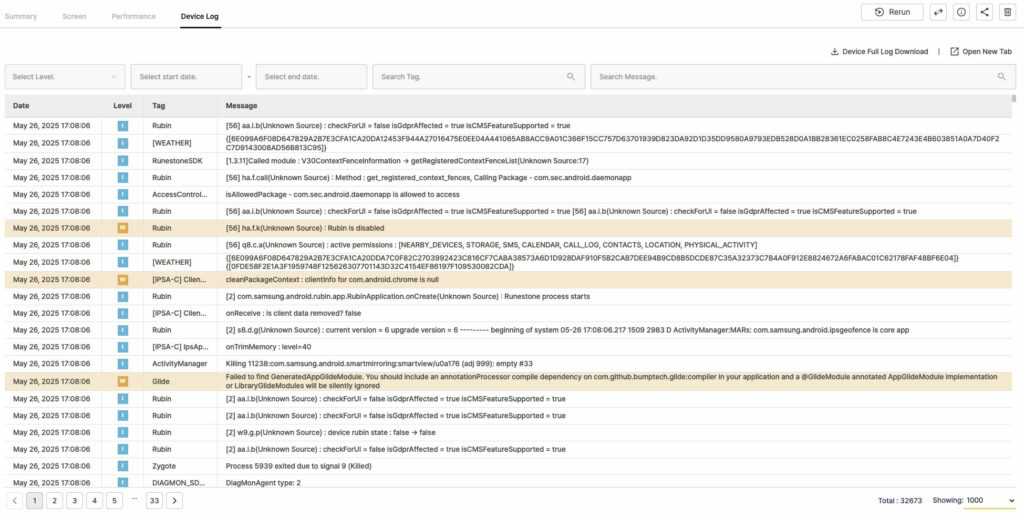
Device Log tab #
Full device logs collected during the test.
Log actions #
- Download full logs: download all collected logs as a zip file.
- Open in new tab: view the log in a separate browser tab.
Log filtering #
| Filter | Description |
|---|---|
| Select Level | Filter by severity: Notice, Warning, Error, Fault |
| Date Range | Set start and end dates to narrow the log window |
| Search Tag | Filter by log tag |
| Search Message | Search for specific keywords in log messages |
Log table #
| Column | Description |
|---|---|
| Date | Log timestamp |
| Level | Severity level |
| Tag | Log tag |
| Message | Log content |