
This is the screen you’ll spend most of your time in when working with Stego.
Menus and icon positions shift with updates, so don’t memorize them — learn the three areas instead and you’ll always know where to look.
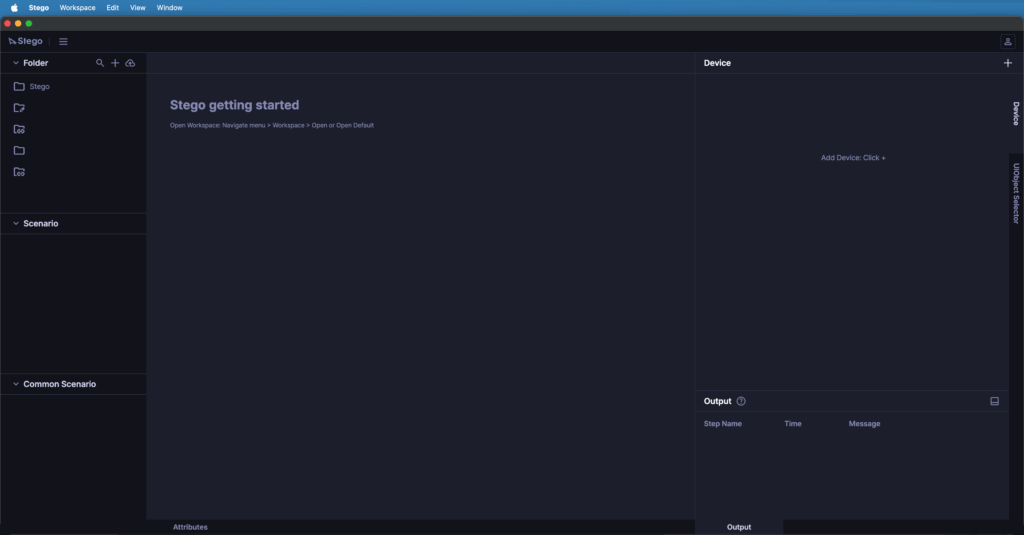
1. Left panel #
This is where you keep your test files and assets organized.
- Folder / Scenario: Group scenarios into folders by feature or milestone.
- Common Scenario: Store flows that repeat across tests — login, onboarding, permissions — and call them from any scenario.
2. Center #
The main area where you build and run your test flows.
- Scenario Editor: The canvas where your test logic lives. Build steps top to bottom by recording device interactions or adding them manually.
- Attributes: Below the editor — configure the detailed conditions and properties of the selected step.
3. Right panel #
Interact with connected hardware and review execution logs. The top-right toolbar also lives here.
- ··· icon: Web and Desktop share File (create, save), Debug (run), View (reset panels, zoom), and Help (release notes).
- Settings (Web only): Click the profile icon to manage License, Profile, and Language.
- Team (Web only): Click the team name to switch between teams.
- Device: See a live mirror of your device and control it remotely with taps and swipes. The panel can be popped out into a separate window — handy on dual monitors where you keep the scenario editor on one screen and the device on the other.
- Record: Gestures on the mirrored screen are only converted into scenario steps when this tab is active.
- UIObject Selector: Extract specific UI elements and tune which AI detection method (OCR, vision, etc.) Stego uses to find them.
- Output: A live console showing step-by-step pass/fail results after each debug run.
Menu bar (Desktop only):
The OS-native menu bar adds version and update info (Stego) and workspace folder switching (Workspace).